|
iQue Forecyt® Reference Guide (Version 9.0)
|
Show Backgate
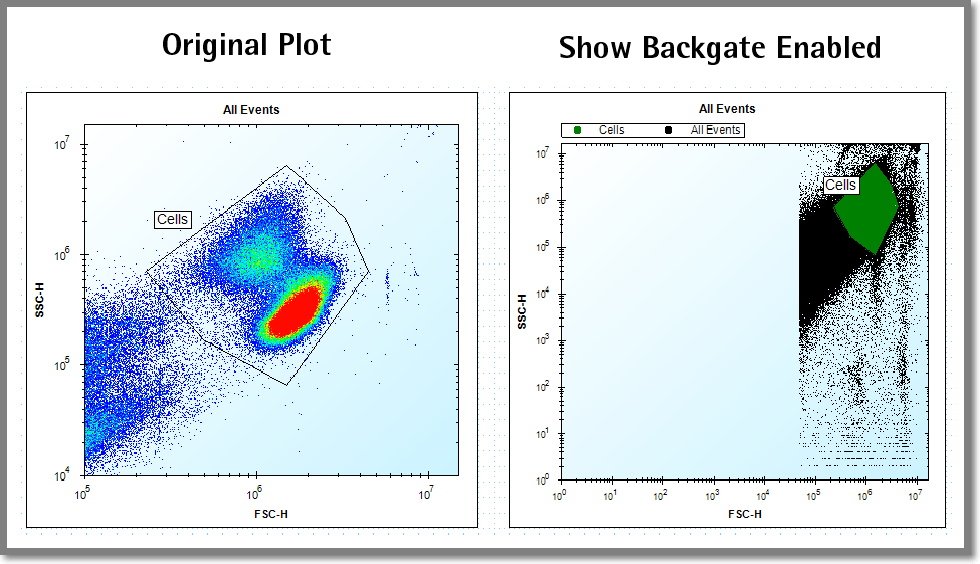
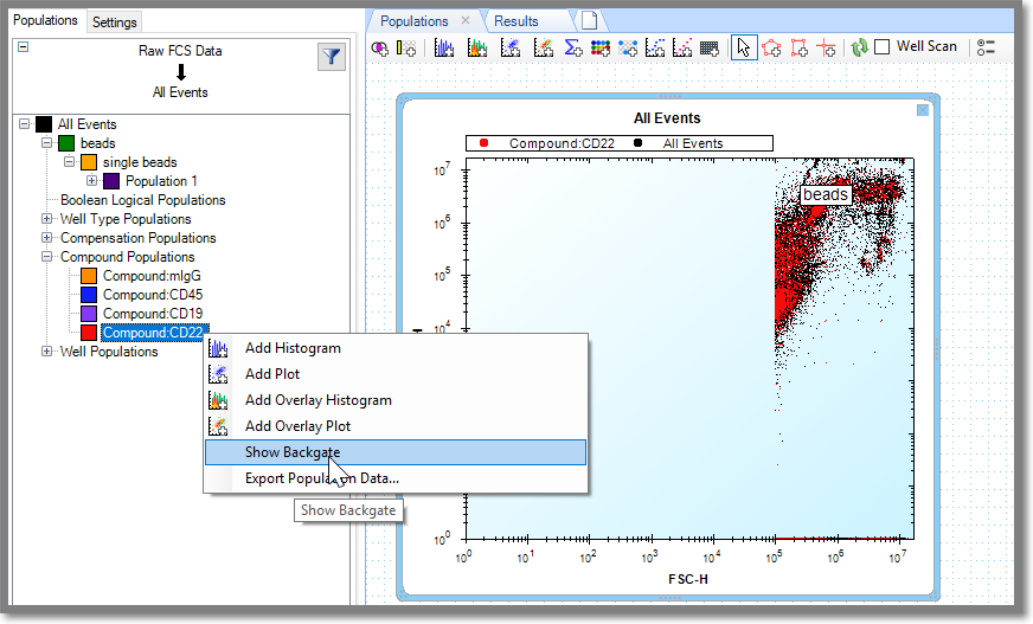
Backgating provides a quick way to create an overlay population to validate or explore the location of a gated population. It's a sanity check to confirm gating strategy, particularly for forward scatter vs. side scatter. When you select a population or gate and choose Show Backgate, iQue Forecyt® creates an overlay plot on FSC-H vs. SSC-H. The input population is All Events. iQue Forecyt® then displays the selected populations superimposed on the All Events populations, as shown in the following screenshot. This overlay plot will function the same as any other overlay plot. Show Backgate can also be accessed by right-clicking on a population in the Populations sidebar
To enable Show Backgate, you must click directly on a gate, or a population in the Populations sidebar. If you just click in a plot, Show Backgate will be dimmed.

The following screenshot illustrates Show Backgate from the Populations sidebar.
